Stats Centre Reports: Neighbourhood stats you can share with clients
There’s no better tool for communicating local, area-level, trends in the housing market than our free Stats Centre reports.
Each month, we email you the report for the area where your office is located. We also include a link for you to access any of the 20 other monthly Stats Centre reports. Missed the email? No problem – you can find the reports at REBGV.ca.
What’s in Stats Centre Reports?
These five-page reports capture the latest:
- sales,
- listings,
- days on market, and
- price activity.
All broken down by property type in a visual, easy to read format.
Get neighbourhood details
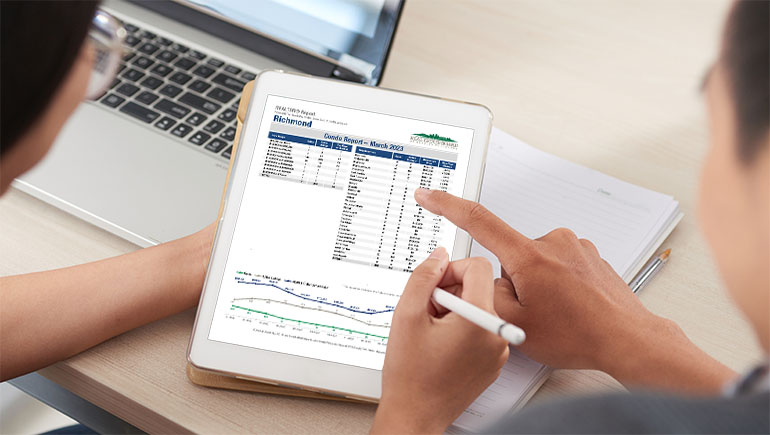
Stats Centre Reports also summarize activity at the neighbourhood or sub-area level.
In our Richmond report, for example, you can see sale, listing, and price trends for Steveston, Broadmoor and every other sub-area in the city.
Share these reports with your clients
We created these free reports with you in mind. Share them with new and existing clients by email and on your websites and social media channels.
You can also use this HTML code to embed the reports within your website. The code is dynamic, so you only embed it once and it’ll automatically update when a new report is available.
For more information on our Stats Centre reports, contact the Help Desk at 604-730-3020.